Random Thoughts on the Election Results
1) How did things change from the 2004 election?
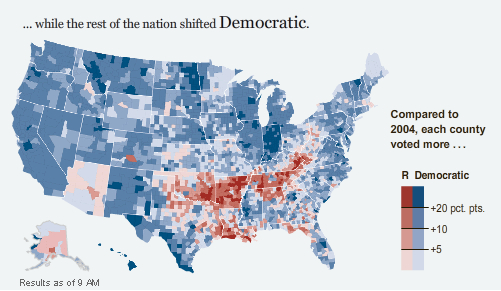
Basically there was just a big shift to the Democratic party throughout the entire US as seen in the map below or this scatterplot.
Kevin Drum lists the demographics that shifted the most since 2004:
Income $200,000 or more (+34), First-time voters (+33), No high school (+27), Latinos (+27), 18-29 year olds (+25), Under $15,000 (+21), Full-time workers (+19), Urban (+19), Non-gun owners (+18), Non-religious (+16), Parents with children under 18 (+16)It isn't clear to me if Bush voters from '04 switched for Obama in '08, or if Obama attracted new voters and many of the Bush voters stayed home. CNN's exit polls have Obama and McCain splitting voters that voted previously, with Obama getting getting his entire margin of victory by winning first time voters 71% to 29%. But, 37% of voters said they voted for Kerry in 2004 vs. 46% that said they voted for Bush. That is very strange as it means that Bush voters were more likely to vote in '08 than Kerry voters. I am skeptical of that.
2) Does no one vote in their own economic interest anymore?
Thomas Frank wrote What's the Matter With Kansas about how lower income individuals were voting against their economic interests by voting Republican. Looking at this chart from Red State Blue State Rich State Poor State, the correct question now is What is the matter with Connecticut?
 Those with incomes over $200,000 voted more for Obama than McCain even though Obama promised to raise the taxes on those making over $250,000 and McCain didn't.
3) Who were the black people who didn't vote for Obama?
Obama won the black vote 95%-5%. Some dictators in 3rd world countries don't get that level in rigged elections. But, that still means there were around 800,000 black voters who went for McCain. Those people had some serious moxy and I would love to hear more about who they are and what their reasoning was.
4) What do things look like for 2012?
If 5% of over 65 voters die each year, then by 2012 then 18% of them will be gone. They accounted for 16% of all voters, so this will be a drop of 3%. Over 65 voters went 55% for McCain, while under 29 voters went 66% for Obama. Assuming that those 3% of old voters are replaced with new under 29 voters and that they vote in similar percentages, this would be a pickup of .63% for Obama (or a 1.26% swing). That is a fairly significant pickup based just on demographic changes and makes it that much tougher for the Republicans to compete. See also this chart.
5) At 53%, Obama got a higher percentage of the popular vote than Clinton or Carter. He even had a higher % of voters than Reagan in 1980. But, with 66 million votes, this still means that only 22% of the US population of 305 million cast a vote for him.
6) Cool election maps: NY Times county bubbles map, red, blue, purple 2004 vs. 2008 (or in black and white), red, blue, purple cartogram, and the under 29 vote.
7) While this election was hyped to have huge turn out, it appears that the percentage of those eligible to vote was fairly similar to 2004. The turnout of those under 29 was up though.
8) 538.com did a fantastic job predicting the outcome.
9) It is hard to believe that YouTube wasn't around in 2004. I couldn't imagine following this election without it. Amazing how much things change in 4 years. How did we follow elections before YouTube?
Update: Forgot one that I meant to mention. While minorities voted for Obama in higher percentages, Democrats gained more white votes (2.8 million) then minority votes (2.4 million) from 2004 to 2008 according to analysis by the Audacious Epigone. Also this chart on black and Hispanic share of population and vote is interesting. Hispanics now comprise a larger percentage of Americans than blacks, but a much lower percentage of voters.


2 comments:
Intersting stuff.
I'm sure you were being somewhat facetious, but many people do still vote in their own economic interest (the under $15k electorate being an obvious example), but the wealthy in red states still vote heavily Republican. For example, in Texas, those making over $200k went for McCain 65%-30%, while those making under $15k voted against him 70%-29%. In Minnesota, the wealth spread was much less important: McCain lost the $200+ 54%-46% and the under $15k 33%-64%. I understand (I've not yet read Red State Blue State but it's on the way) this is a major theme identified in the book--red states demonstrate the conventionally presumed economic spread between Democrats and Republicans much better than blue states do.
AE,
Yes I was being somewhat facetious with that statement. But, it is surprising to me just how few people do vote in their economic interest. I would think it would be like 90% and yet it is no where near that close.
Interesting point you make how it differs at the state level.
Post a Comment
Note: Only a member of this blog may post a comment.