Wednesday, September 13, 2006

Best of Technology

My Favorites:
How to make expandable posts in Blogger
How much research is being done in the world?
Hamster powered cellphone charger

Best of the Rest:
4 robotic racers cross desert
What Wal-Mart knows about its customers
Morse coders faster than SMSers
VideoJug
3 features DVD players need
In Praise of My Japanese Cellphone
State of the Blogosphere
Japan and Broadband
Google puts lid on new products

Research and Development
World of R&D 2005
Pentagon redirects its research
Israel's technology industry
China is world's largest exporter of IT
India's R&D reaching for the top
Skill gap hurts technology boom in India
US vs. Chinese engineers and a Kurzweil interview
The age of invention is over

Product Reviews
Google Reader
Yahoo Mail Beta
Google Notebook
Rhapsody on Real Rhapsody
Mozy: Free Online Backup

Read More...

Best of Brain

My Favorites:
USB port to the brain
Robot arm controlled by thought
Using an MRI to control pain

Best of the Rest:
The interaction between brains and computer is seen via a USB port to the brain (and part II), the BrainGate (and video of the BrainGate in action), a robot arm controlled by thought, brain cells in a dish flies a simulated fighter, and seeing through your tongue. (See also Best of Cyborgs)

When it comes to pain, happiness and depression we have a a depression switch, placebos and pain, using an MRI to control pain, donating to charity rewards the brain, a genetic influence for depression, scans of monks brains, a happiness brain implant, and (to reduce the terrorists pain) neuroimaging
is replacing torture
.

Study spots the brain's selfishness off-switch
Slow your brainwaves for creativity
Mens', womens', and Einstein's brain
Nanotech helps blind hamsters to see
Brain development and intelligence
Gene may be the key to brain evolution
Schizoprenia brain fault found
Applying current can boost brain power
Brain wave sensing device for prevention of drowsiness at the wheel
The art of seeing without sight
Trust your instincts

Read More...

Best of Genetics

My Favorites:
Create life from your computer
Humans are still evolving
Pregnant moms to start taking steroids

Best of the Rest:
The evolution of humanity is being investigated with the Genographic project and leading to genetic tests for ancestry.

The diversity of human genetics is being cataloged with Hapmap. A gene has been discovered that may be the key to brain development from chimps to humans. Stress impacts your genes.

I can't wait for the genetic tests of the future as scientists are now finding genetic influences for domestication, HIV resistance, depression, cocaine addiction, caffeine metabolism and nicotine addiction.

Read More...

Best of Cyborgs

My Favorites:
See through your tongue
Remote control shark spy
Happiness brain implant

Best of the Rest:

Body Monitoring
A whole bunch of devices are being developed to help monitor the body and interact with computers. There is a brain wave sensing device for prevention of drowsiness at the wheel, underwear that monitors the amount of body movement for weight loss, a t-shirt with embedded wires called the Lifeshirt for gauging heart rate and measuring respiration, a glucose monitoring watch and a wristwatch called the Exmocare that monitors pulse, heart rate and motion.

On the stress and concentration side, we have a relaxation sensor that can be played as a game, the stress eraser for measuring stress with an iPod like device, a video game that promotes competitive relaxation and a tech gadget helps boost concentration.

To interact with a computer by thinking we have Cyberlinks's Brainfinger, a personal computer acting as mind reader, and gamers may soon control action with thoughts.

Implants
Popular Science has an overview of human upgrades. Neural implants are being developed to cure many diseases including a happiness brain implant. These devices will get energy from blood powered fuel cells and body temperature powered batteries. The senses will soon be augmented as seen by robo chick with artificial eyes, a device that allows you to see through your tongue and I lay out what I want to be able to hear when I pimp my cochlear implant. 1st Woman With Bionic Arm.

Brain implants are the holy grail of cyborg implants. This is starting to happen with a USB port to the brain (and part II), the BrainGate, and a robot arm controlled by thought. (See also Best of Brain)

Animal cyborgs
The Pentagon is planning a cyber insect army along with a remote control shark spy.

Reverse cyborgs
While I had thought that humans and animals would become more like machines, now the reverse is also happening as machines and robots are becoming more biological. Brain cells in a dish fly a simulated fighter, an Ecobot eats dead flies for fuel and cars will start using bacterial enzymes for improved catalysts.

Read More...

Best of Men vs. Women

My Favorites:
Women trail in competitive drive
135 women graduate college for every 100 men
Men's, women's and Einstein's brain

Best of the Rest:
Chicks and science
Larry Summers on women's education (no, its not what you are thinking)
Exploiting the gender gap
Female professional workers as % of total workforce
Campus gender gap
The male condition
The weaker sex
Men not working and not wanting just any job

Read More...

Best of Funny

My Favorites:
Barry Bonds: My Head Isn't Bigger
Quick Monkey Facts
Couple of Noodles Short
Shot Down in a Blaze of Glory
Underwear Goes on the Inside of the Pants

Best of the Rest:
Foley's Perverted IMs: A Dramatic Reenactment
Nerd Humor
Can You Hear Me Now?
Tron Guy
Japanese Kamasutra
Oprah Celebrates 20,000th Pound Lost
Gaylords and Ass Clowns
Google Suggest Gets Suggestive
Herring Break Wind to Communicate
McDonald's to Outsource Drive Thrus
Engrish
I See Dead People
More Chickens is Cure for Avian Flu
San Francisco to Recycle Dog Crap
Schizophrenic or Cellphone?

Videos
Lost Mac Ads
Worst TV Clip of the Week
I am no Longer Afraid of Chinese Competition
CO2: We Call it Life
iPod Flea

Photos
Not in Front of the Children
Why You Shouldn't Eat Mexican Before Figure Skating
Quick Close your Eyes
Family

Read More...

Best of Original Pieces

My Favorites:
Fog of life
New way to look at population control
Top 1% of humanity

Best of the Rest:
Bold ideas to change America
The military video game complex
More killed by suicide than war
The age of invention is over
How much research is being done in the world?
Revelations from 1491
Ebay renting
Pregnant moms to start taking steroids
Productivity in the digital economy
The Brain drain myth
My pro life agenda

Read More...

Best of Other

My Favorites:
5%, 25%, 50%
More prisoners than farmers in the US
More killed by suicide than war

Best of the Rest:
New theory on the beginning of life
Benford's law
How to be creative
Going bananas
The military video game complex
50% of scientific papers are wrong
Revelations from 1491
Making difficult decisions in an uncertain world
Increase trust with nasal spray
Worst mistake in history of human race
Woldmapper
Average American family has more stuff than the Egyptian pharaohs

Death (Sorry Old Actuary in Me)
191 million die due to war in 20th century
20,000 people perished yesterday
153,000 people dead today
More killed by suicide than war
Washing hands could save 103,000 lives a year

Read More...

Tuesday, September 12, 2006

Marines vs. Fishermen

In the Iraq vs. Philly post, I wondered how the fatality rate of a job in the military compared with other dangerous jobs. I emailed the author of the Op-Ed and he was kind enough to send me the working draft of the paper he is writing.

So which is the more dangerous job, a fisherman or a Marine?

Based on the data provided (Table 2), a Marine has a death rate of 8.48 per 1,000 or 848 per 100,000 for the time he spends in Iraq. But, 70 of those deaths come from non-combat violent deaths and 14 from deaths from disease (actually these are averages for all military, but I will assume it is close for Marines) vs rates of 98 and 43 for the men aged 20-34 living in the US (Table 1). I am not going to consider that part of job, but rather just part of being a young male and removing it from the comparison. That leaves us at 848-84= 764 deaths per 100,000. I am also going to assume that if you sign up for the Marines you enlist for 2 years of which one is training, so that only 1/2 of your time is spent in Iraq. I will also assume that the death rate for being in training is zero (or close enough that it isn't important). That leaves the "on the job" fatality rate for a Marine over his two years at (764/2=) 382 per 100,000.


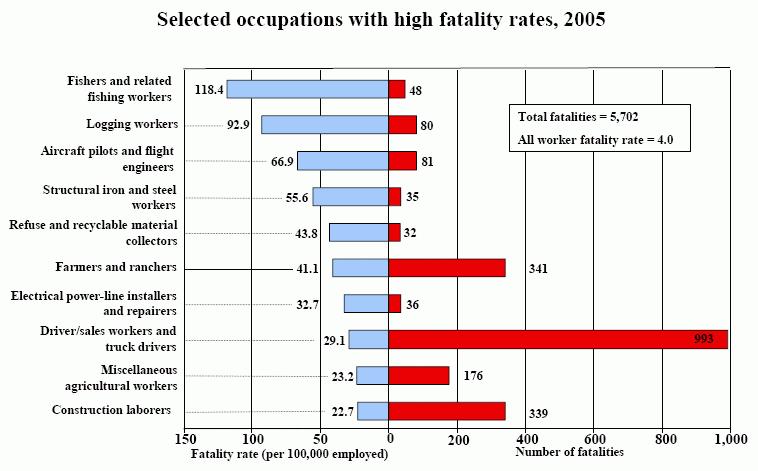
Based on this report from the BLS the highest fatality rate for any job category is fishers and related fishing work at 118.4 per 100,000. If you would like to see what makes this so dangerous, check out the Discovery Channel's The Deadliest Catch.

The fatality rate is therefore (382/118.4=) 3.2 times as high for Marines. Definitely more dangerous to be a Marine than a fisherman but they are closer than one might expect. In fact, you would would reduce your chance of dying more by switching your job from a fisherman to a construction worker (fatality rate 22.7) which would reduce your chance of dying by 81% (118.4 down to 22.7) than you would by switching from a marine to a fisherman which would reduce your chance of dying by 69% (382 down to 118).

What about other branches of the military? I believe that almost all Marines are front line troops and would guess that front line combatants in other branches of the military would have a similar rate of death as the Marines. The reason for the other branch's lower levels have to do with the higher percentage of troops which are not on the front line.

The rate of death for the army is 394 per 100,000. Once again removing the non-combat violent deaths and deaths from disease and assuming that 1/2 of an army enlistee's time is spent in Iraq the rate becomes 155 per 100,000. This still makes it more dangerous that a fisherman, but only 1.3 times as high.

The rate of death in the navy and air force is 83 and 40 per 100,000 respectively. This is actually lower than the average non-combat violent deaths and deaths from diseases for all branches. I don't know how to explain this, but obviously it is much more lower for these branches. I have no idea what it would be, so I will just ignore it for now and know that these values will be slightly high. Assuming once again that 1/2 of the time is spent in Iraq (not sure how good of an assumption that is for these branches they might actually spend less time in Iraq) that would put the rates at 42 and 20. This is quite a bit lower than the fisherman, and close to that of a refuse and recyclable materials collector (aka garbage men) at 43.8 and construction laborers (22.7). The average fatality rate for all workers in the US is 4.0 per 100,000.

Overall, enlisting in the US military while we are at war in Iraq is dangerous but not as dangerous as you might think.

Read More...

Sunday, September 10, 2006

50 Gallons of Gasoline in Each PC

Well not exactly, but there the energy equivalent of 50 gallons used in the production of a PC and 17" CRT monitor, according to a report by Eric Williams of the United Nations University. He calculates that it takes 6,400MJ to produce them. 1 gallon of gasoline contains 131MJ of energy, so this works out to 48.9 gallons. This is approximately the amount of gasoline that an average American uses to fuel their car each month.

Another surprising statistic from the report is that in the standard 3 year lifespan of a PC and monitor, 81% of the energy is used to create them and only 19% is used to run them. To contrast that, a refrigerator uses 11% of its life cycle energy to be produced and 89% to run it. A car typically uses around 20% to produce.

According to the report a typical Pentium III system with 17-in. CRT monitor consumes on average 128 W when fully on 3 h use per day full-on (no standby). This works out to 384Wh a day or 140kWh a year or 420kWh over a standard 3 year lifetime of a PC. 420kWh is equivalent to 1500MJ, so it takes 6400MJ to produce a computer, 1500MJ to run it for a total of 7900MJ or 2633MJ/year of use (or 20 gallons of gasoline equivalent).

The implication of this is that to reduce the amount of energy a PC uses it is much more important to focus on manufacturing then on end usage. The Energy Star programs rates PCs and monitors based on how much energy they use, but says nothing about how much energy it takes to produce them. EPEAT rates computers based on how environmentally aware they are, but does not take energy of production into account. Here is a chart of where the energy goes.

direct fossil (MJ)electricity use (kWh)total energy (MJ)% of production% of total
production
process analysis
semiconductor29817090914.2%11.5%
printed circuit boards26.77.7540.8%0.7%
CRT manufacture/assembly21012.52554.0%3.2%
bulk materials - control unit0077012.0%9.7%
bulk materials - CRT0080012.5%10.1%
silicon wafers038.11372.1%1.7%
computer assembly35.351.22193.4%2.8%
IO analysis
electronic chemicals38118.54477.0%5.7%
semiconductor manufacturing equipment39229.44987.8%6.3%
passive components10910.31462.3%1.8%
disk drives and other parts365234487.0%5.7%
transport3383.53515.5%4.4%
packaging, documentation1204.81372.1%1.7%
other processes97361119218.6%15.1%
total production32484306400100%
use phase: home user (3 yrs)420150019.0%
total32488507900100%


Semiconductors and bulk materials for the control unit and CRT makeup 31% of the total lifetime energy and look like a place to focus for reduction. I don't know how exactly to improve this, but I would guess using more recyclable metals and plastics would help.

Another option is to lengthen the time of ownership. If a PC is used for 5 years instead of 3, the amount of energy needed per year (taking total lifetime energy and dividing it by total years) goes down from 2633MJ/yr to 1783MJ/yr or a decrease of 32%.

While I think this analysis is very important, I think that some of the numbers are suspect and I hope somebody undertakes another study of the life cycle energy use of PCs soon.

The first issue I have is that this was based on a 2000 PC and 17" CRT. I would like to see the numbers for a 2006 PC and a 17" or 19" LCD. I don't know exactly how it would turn out. PCs and monitors are much cheaper now, which I would think means they are made more efficiently and might therefore use less energy per PC to make. But, monitors have gotten larger and PCs faster which might offset this gain. Also, PCs run faster and use more electricity now, so the 81% to 19% ratio of production to usage might tilt more towards usage. My personal computer (based on Kill-a-Watt readings) uses 85W when nothing is running and 135 when the CPU is at 100% and the DVD is running, so lets call it 100W average. My 19" monitor uses on average 70W, so my 170W is a bit over the 128 W they state.

I would also be interested in the numbers for laptops as more people are using laptops now. My laptop uses 43W, so I would think production energy is much more important for laptops in the life cycle analysis.

I think the methodology he uses might overstate the energy usage of production.
To sum up, pessimistic assumptions on the accuracy of process-sum and IO parts of the analysis yield a possible range of 5000-16 000 MJ (base result: 6400 MJ) for the total energy required to manufacture a desktop system.

The hybrid result of 6400 MJ required to produce a desktop system is considerably higher than the process sum result of the 1998 EU-sponsored study of 3630 MJ.
Other models have had results that are just about 1/2 of what he states, and there is a big margin of error for the number he does report. The economic input-output (IO) methodology also comes up with higher values by including more of the indirect energy costs then the process sum method. In doing an apple to apple comparison I think this might end up estimating on the high side.

When he uses electricity he does not take into account the upstream usage of coal or other fossil fuels that are needed to produce the electricity which typically are only around 30% efficient. Making that change would tilt the energy balance back towards usage.

Another issue is that this assumes the monitor is replaced with the computer. In my experience the monitor usually sticks around for a longer amount of time then the PC does.

Also, now PCs are connected to the internet and there is energy being used by the network and the server machines. The energy usage of my PC should probably take into account this additional energy that is used as part of my computing experience.

The amount of time that you use the PC greatly shifts the balance. Lets look at 3 cases: the typical 3 hours of home use, the 8 hrs a working day for business use and 24 hours for server computers. And lets look at the impact of using it for 5 years instead of the typical 3.

3 years of use5 years of use
hours of use a dayelectricity usage (kwh)% of total energyelectricity usage (kwh)% of total energy
3 hrs4201970028
8 hrs768301,28042
24 hrs3,360655,60076


As the graph shows, the amount of energy used in usage vs. production goes up greatly for business and server machines. A server machine that is used for 5 years has 76% of its life cycle energy in usage and only 24% in production. That goes right along with this article on Google:
He estimates the system power consumption of a single dual-core processor system - which he described as a "successful attempt to reduce processors' runaway energy consumption" - at around 265 watts, which requires another 135 watts of power to cool the system down within a data center. "Over four years, the power costs of running a PC can add up to half of the hardware cost," he writes, and adds: "Saving power is still the name of the game, even to the extent that we shut off the lights in them when no-one is there."
To sum up, unlike cars or refrigerators for home usage of PCs most of the lifetime energy is used in production of the PC rather than in the electricity to run it. That amount of energy for a 2000 PC and 17" CRT monitor was estimated at 6400MJ which is the energy equivalent of almost 50 gallons of gasoline. To reduce energy usage on PCs it makes sense to focus as much on making the production of them efficient as it does on making them run efficiently. It is also important to try and keep a machine running for as long as possible without upgrading. The usage of the machine as a home, business or server machine also makes a huge difference in the life cycle energy analysis. The methodology and data of this report are suspect so I would like to see a new version of this analysis run with 2006 machines, both desktop and laptop.

Read More...

Saturday, September 09, 2006

Interesting Articles of the Week

Snakes on the Brain: how snakes caused primates to evolve better sight.

World of Warcraft is now a billion dollar a year business with almost 7 million players worldwide and 1,800 employees.

"Permanently cheerful" mice offer hope for clinical depression

Fighting poverty with butter.

A younger India is flexing its industrial brawn.

Pandora makes music recommendations based on the music's "DNA".

Stress can stop brain cells from regenerating and depression may be cured by allowing the regeneration to begin again.

Read More...

Can You Hear Me Now?


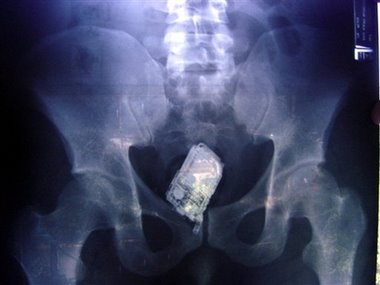
Photograph of a man with a cellphone, um, where the sun don't shine.

Oh, I can't tell you how many times I have dreamed of doing that to some fool who is obnoxiously talking on his phone. But, it turns out that this was not done by an irate bystander. Beyond belief, this was actually done by the individual himself.

Cellular telephones were found inside four prisoners in El Salvador's maximum-security prison, authorities said Wednesday.

Capt. Juan Ramon Arevalo, director of the prison known as Zacatras, said the gang members had introduced the cell phones, wrapped in plastic bags, into their bodies through their anuses. Authorities also found nine cell phone chips and one charger.
Yet another way being a gangster isn't as glamorous in real life as it is on TV.

via My Way

Read More...

Carbon Stabilization Wedges

I am really digging this plan to stabilize carbon emissions put out by Robert Socolow. In my review of An Inconvenient Truth I lamented the fact that Gore laid out no plan on how to deal with global warming and carbon emissions. Socolow's plan was what I was looking for. He lays out what needs to be done, a time frame to do it in, the approximate costs it would take to make it happen, and different ways the goal can be achieved.

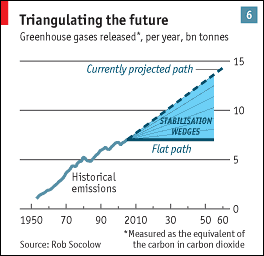
The goal is to stabilize carbon dioxide emissions from 2006 to 2056 and then to cut the 2056 emissions in half over the next 50 years.

From Science (if you can't access it, try clicking on the link from this page):

Very roughly, stabilization at 500 ppm requires that emissions be held near the present level of 7 billion tons of carbon per year (GtC/year) for the next 50 years, even though they are currently on course to more than double.

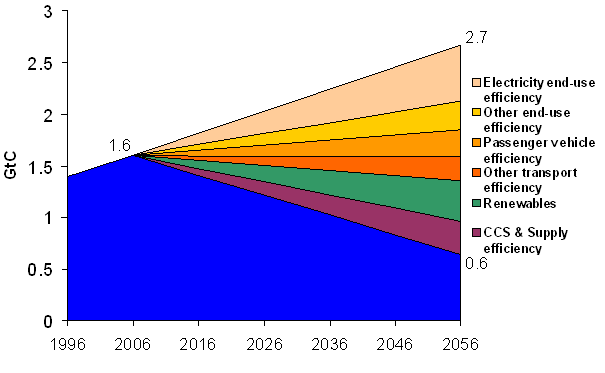
To keep the focus on technologies that have the potential to produce a material difference by 2054, we divide the stabilization triangle into seven equal "wedges." A wedge represents an activity that reduces emissions to the atmosphere that starts at zero today and increases linearly until it accounts for 1 GtC/year of reduced carbon emissions in 50 years.
He shows 15 possible wedges. Examples include:
-Increase fuel economy for 2 billion cars from 30 to 60 mpg
-Cut carbon emissions by one-fourth in buildings and appliances projected for 2054
-Introduce Carbon Capture and Storage at 800 GW coal or 1600 GW natural gas
-Decrease tropical deforestation to zero instead of 0.5 GtC/year, and establish 300 Mha of new tree plantations


In Scientific American he lays out the cost of this plan. A carbon tax needed to jump start this transition is in the ballpark of $100-$200 per ton of carbon. One ton of carbon is carried in 2.7 tons of CO2 so this price is equivalent to $27 per ton of CO2. Based on carbon content $100 per ton of carbon is $12 per barrel of oil and $60 per ton of coal. It is $.25 per gallon of gasoline and 2 cents per kWh of electricity from coal. These are not trivial costs, but they are not back breaking either.

The plan calls for a 60% reduction in OECD nations by 2050 which would allow non-OECD to emit 60% more. Even by doing this the OECD countries will still be emitting 2 times as much per capita.

What it would take for the US to hit that reduction is laid out in this Scientific American article.

There are more write ups on this idea, see World Changing, The Economist and a second Economist article. This is a nice slide show of the key points.

Some believe that the estimate of 7 wedges is too low, that it might actually be closer to 29. I don't know enough to judge, but even if this were true then you could still keep the same framework, but just implement more changes quicker.

Implementing the wedges will have benefits beyond global warming and carbon dioxide emissions. Reducing oil and natural gas usage will make the United States less dependant on dangerous parts of the world. Reducing our usage of coal will have many health and environmental benefits by limiting mercury emissions, reducing acid rain, minimizing other air pollutants and stopping the dangerous and environmentally damaging mining. Stopping deforestation and implementing reforestation will make the world better for nature.

This is the first comprehensive plan I have seen describing what it would take to stabilize carbon emissions. I like the idea of trying to stabilize emissions over the next 50 years while bringing the developing world into modern economies. Then over the next 50 years carbon emissions we can try and reduce those emissions. I think the breakdown of how much industrialized countries need to cut back vs. developing nations is fair, but this can be debated. There are costs to the plan but they are not overwhelming. If nothing else this seems like an excellent place to start in determining how to combat global warming.

Read More...

Friday, September 08, 2006

Are CO2 Levels at Historical Highs?

I was reading an article in Scientific American that stated that an atmospheric carbon dioxide concentration of 560 parts per million (ppm or µL/L) is widely regarded as capable of triggering severe climate changes. Currently the level is at 380ppm. So, I wondered to myself, how do these values compare to historical levels?

The answer depends on how historical you want to go.

Although contemporary CO2 concentrations were exceeded during earlier geological epochs, present carbon dioxide levels are likely higher now than at any time during the past 20 million years and at the same time lower than at any time in history if we look at time scales longer than 50 million years.

In more recent times, atmospheric CO2 concentration continued to fall after about 60 Myr BP, and there is geochemical evidence that concentrations were <300 µL/L by about 20 Myr BP.
As the graph shows, over the last 500,000 years we are at a high. CO2 levels were 280ppm before the industrial revolution, about the high of the cycles throughout the last 500,000 years. Now we are way beyond that.

But, if you expand your time horizon "a bit" further it appears that our current levels are on the low side.
While these measurements give much less precise estimates of carbon dioxide concentration than ice cores, there is evidence for very high CO2 concentrations (>3,000 µL/L) between 600 and 400 Myr BP and between 200 and 150 Myr BP.
As this graph shows, CO2 levels are much lower (almost ten times lower) than they were when dinosaurs walked the earth 150 million years ago.

I don't know where scientists come up with the fact that 560ppm will cause severe climate change, but it is certainly true that the earth has sustained life before with much higher levels. Some worry that the earth will become like Venus and be completely inhabitable. Seems unlikely given that the dinosaurs and other creatures were able to thrive in the higher levels.

I have written before that we should figure out the best temperature for life on earth and get the earth to that level. But, I overlooked the issue that the rate of temperature change might be more important than the actual average temperature. If the temperature increases gradually it gives species time to adapt while a sudden change doesn't. So, the scientists are probably right to worry about rapidly rising levels of CO2, but I wish we understood more what the impact of higher CO2 levels and temperatures meant for life on earth back in the days of the dinosaurs.

via Wikipedia

Read More...

In Praise of My Japanese Cellphone

Have I complained about how far the US is behind Japan and the rest of the world in cellphone technology lately?

Thanks to early investments in high-speed mobile networks, Japan’s cellular telephone industry is about a year and a half ahead of America’s.

Subway riders tap messages to friends, listen to music and play games on their handsets. More than half of Japan’s cell-phone users own speedy 3G broadband phones (versus a puny 5 percent in the United States).

The Japanese have enjoyed analog TV on their mobile phones since 2003, but the quality was erratic and users would lose the signal on moving trains. Earlier this year, the carriers unveiled a new digital TV standard, devised solely for mobile devices. The quality is excellent. My phone not only played seamless television but let me record, TiVo-style, up to five hours of TV on a one-gigabyte memory card.

In Japan, 90 percent of all downloaded songs are enjoyed on mobile phones, rather than to PC-tethered devices like the iPod. I followed along, downloading the J-pop hit “Super Sonic” from singer Koda Kumi for 262 yen ($2.26) from the mobile music store Chaku Uta, and made it my ringtone.

Vodafone allows subscribers to use a national electronic cash network called Edy. Edy reader next in a café to buy coffee and a pastry. It automatically deducted money from my account. Thousands of stores, vending machines, train stations and taxicabs accept e-money in Japan—and the mobile carriers will soon add a credit-card function, so you can buy now, pay later and leave your wallet at home.

Unlike a majority of new Japanese phones, Vodafone’s 905SH doesn’t have a GPS chip or mapping software to help users negotiate the baffling geography of Japan’s cities. I nevertheless got to try out that feature while utterly lost one day in Tokyo’s Ikebukuro entertainment district. As we set out for dinner, our friend Patrick whistled up the “ez navi” GPS software on his AU phone and tapped in the coordinates of the restaurant where we had reservations. Holding up the phone like a "Star Trek" tricorder, we walked past the incomprehensible street signs, following the blinking green line on the screen to our destination. Captain Kirk would be proud.
TV, GPS, music, e-wallet, a society that texts rather than talks so you are never annoyed by others, they have it all. I guess I can look forward to those things one and a half years from now, well except for the lack of annoying cellphone users part.

via Newsweek

Read More...